









Part of: Divorce Specialists
The latest UK divorce rate is 8.4 divorces for every 1,000 people in an opposite-sex marriage, and 19.5 for every 1,000 people in a same-sex marriage. These are the 2025 figures for England and Wales, the most recent year the Office for National Statistics (ONS) has published. That year, 105,002 couples divorced, a figure close to 2023 and 2024 and well below the peaks of the 1990s (ONS, Divorces and dissolutions in England and Wales: 2024 and 2025, released 23 September 2026). Scotland and Northern Ireland count their own divorces. If the numbers have you thinking about your own marriage, our divorce specialists assist and advise people at every stage.
This guide explains what the figures mean, how they have changed and what they cannot tell you about your own case. It covers England and Wales only, because that is the single jurisdiction the ONS reports on.
Reviewed by: Iblal Iqbal, Partner & Family Law Strategist, Kabir Family Law
Key takeaways
- The latest year is 2025. There were 105,002 divorces in England and Wales, or 8.4 per 1,000 people in an opposite-sex marriage (ONS).
- The long-term trend is down. The opposite-sex divorce rate has fallen from its 1993 peak of 14.2 per 1,000, and has sat close to 8.4 for the last three years.
- It is not half of all marriages. Of couples who married in 1998, 40.7% had divorced by their 25th wedding anniversary.
- Most marriages that end last over a decade. The median length of an opposite-sex marriage that ended in divorce in 2025 was 13.0 years, the longest since the figures began in 1963.
- Your own case is not a statistic. You cannot apply in the first year of marriage (Matrimonial Causes Act 1973, s.3), and the order of each step can affect your money.
What is the divorce rate in the UK?
Most people who ask about the UK divorce rate mean the ONS figure for England and Wales. ONS counts the divorces granted in a year for every 1,000 married people. So it measures how many married people divorce in a given year, not how many marriages will fail in the end.
In 2025, the rate was 8.4 per 1,000 people in an opposite-sex marriage and 19.5 per 1,000 in a same-sex marriage. ONS changed how it works these rates out in the September 2026 release, so the two can now be compared, and it has applied the new method back through the whole series. Rates up to 2024 are based on the married population aged 16 and over; the 2025 rate is based on those aged 18 and over, after the minimum age for marriage rose in February 2023.
Is there a separate divorce rate for England?
No. There is no England-only figure, because ONS publishes divorce statistics for England and Wales together as one jurisdiction. When you search for the divorce rate in England, the number you are shown is almost always the England and Wales figure, so the 8.4 rate above is the honest answer. The same law applies on both sides of the border and the same courts deal with it, which is why the two are counted as one.
Divorce rate UK: the latest divorce statistics
The bulletin covering 2024 and 2025, published on 23 September 2026, is the latest ONS release. It also shows how far the new divorce law has spread through the courts.

- 105,002 divorces and 959 civil partnership dissolutions took place in 2025.
- 94.2% of endings went through under the new law, up from 9.2% in 2022.
- 74.3% of new-law divorces came from one spouse applying alone, rather than a joint application.
- 61.2% of sole applications by opposite-sex couples came from the wife.
- 2,123 same-sex divorces took place, the highest yearly figure so far.
These UK divorce statistics describe England and Wales as a whole. They say nothing about why a particular marriage ended, or how a couple split their money.
Is the UK divorce rate rising or falling?
Over the long run, the UK divorce rate is falling. ONS says the opposite-sex rate has declined from its peak of 14.2 per 1,000 in 1993. It has now held close to 8.4 for three years running, so the recent picture is steady rather than rising. The dip in 2022 was the law changing, not marriages suddenly getting stronger.
| Year | Divorces | Rate per 1,000 in an opposite-sex marriage | What sits behind the figure |
|---|---|---|---|
| 1971 | 74,437 | 5.9 | The Divorce Reform Act 1969 took effect on 1 January 1971 and made divorce easier. |
| 1993 | 165,018 | 14.2 | The highest rate on record. Numbers stayed near 150,000 a year into the early 2000s. |
| 2021 | 113,505 | 9.4 | May partly reflect delays to court work during the pandemic in 2020. |
| 2022 | 80,057 | 6.6 | New waiting periods began on 6 April 2022. This was the lowest number since 1971. |
| 2023 | 102,678 | 8.3 | Numbers returned to roughly where they sat before the pandemic. |
| 2024 | 104,762 | 8.4 | Almost unchanged on 2023. |
| 2025 | 105,002 | 8.4 | The latest year published. |
Source: the ONS bulletin and workbook for 2024 and 2025, which restates the rates for every earlier year on the current method. Same-sex marriage did not exist in England and Wales before 2014, so the rate column is opposite-sex throughout.
The new law took effect on 6 April 2022 (SI 2022/283, reg. 2). It added a 20-week wait from the start of proceedings before an applicant can confirm they want to continue (Matrimonial Causes Act 1973, s.1). ONS says this may partly explain the low 2022 figure. Our guide to no-fault divorce explains how the current process works. People are also marrying later, which is one reason marriages now last longer before they end. For opposite-sex couples, the median age at marriage in 2023 was 34.8 for men and 33.0 for women, among the highest ever recorded (ONS, Marriages and civil partnerships in England and Wales: 2023).
What percentage of marriages end in divorce in the UK?
There is no single official percentage, because ONS follows each year’s weddings over time instead. To answer how many marriages end in divorce, it tracks everyone who married in a given year and counts how many have divorced by each anniversary. That is a different measure from the UK divorce rate above, and it is the one to use if you want to know how many weddings end in divorce rather than how many divorces happen in a year. The latest figures for England and Wales show:
- Married in 1963: 7.8% had divorced by their 10th anniversary, 22.8% by their 25th and 27.1% by their 60th.
- Married in 1998: 23.6% had divorced by their 10th anniversary and 40.7% by their 25th.
- Married in 2013: 16.8% had divorced by their 10th anniversary.
- Married in 2015: 16.3% had divorced by their 10th anniversary, the lowest of any recent cohort at that point.
So the claim that half of all weddings end in divorce does not match the ONS figures. A smaller share of couples who married in 2013 or 2015 divorced within ten years than of those who married in 1998. Even so, the 2013 figure is more than double the 1963 figure at the same point. The turning point was the mid-1990s: of couples who married in 1995, 24.7% had divorced by their 10th anniversary, and every cohort since has come in lower.
How long does the average marriage last in the UK before divorce?
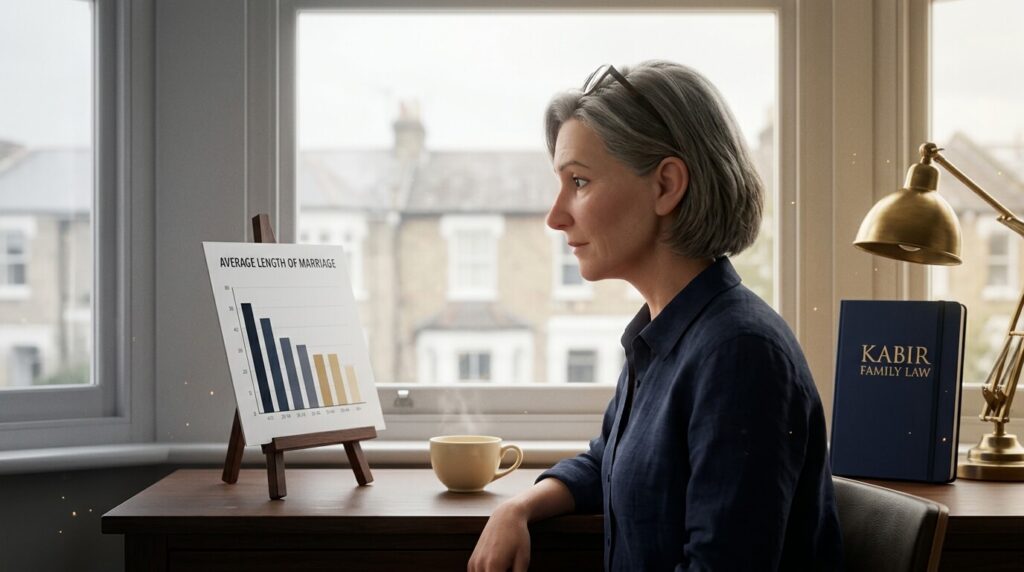
For opposite-sex couples who divorced in 2025, the median length of the marriage was 13.0 years, the longest since the series began in 1963. Half of those marriages were shorter and half were longer. For same-sex couples, it was 7.5 years for male couples and 6.6 years for female couples.
Among opposite-sex couples married for under 30 years, the most common length was 6 years, with 5,245 divorces in 2025. By contrast, the shortest median on record was 8.9 years, in 1985, so marriages that end now last four years longer than they did then. Keep in mind that these figures describe marriages that ended in divorce, not the average length of all marriages in the UK. Also, no one can apply for a divorce in the first year of marriage, so the very shortest marriages never appear in the UK divorce rate.
Divorce rate UK by age: when do most people divorce?
ONS no longer publishes age at divorce. From the 2020 data year, HM Courts and Tribunals Service stopped collecting it, so ONS can no longer report it (ONS, 2020 bulletin).
The older figures still give a guide. In 2018, the average age at divorce for opposite-sex couples was 46.9 for men and 44.5 for women (ONS, 2018 bulletin). That average had risen every year since 1985, as couples married later and stayed married longer. A year earlier, in 2017, rates were highest for men aged 45 to 49 and women aged 40 to 44 (ONS, 2017 bulletin).
How does the UK divorce rate compare with other countries?
Official divorce rates by country use different measures. Eurostat, the EU’s statistics office, counts divorces for every 1,000 people of all ages. In 2024, the EU figure was 1.6 (Eurostat, Marriage and divorce statistics).
- Highest divorce rates in the EU: Latvia (2.8), Lithuania (2.5), then Estonia, Finland and Sweden (2.1 each).
- Lowest: Malta (0.9), Slovenia (1.0) and Romania (1.1).
The UK is not in these EU tables, and ONS counts per 1,000 married people instead. As a rough guide, though, 105,002 divorces in a population of 62.0 million works out at about 1.7 per 1,000 people in England and Wales in 2025 (our calculation, using ONS population estimates for mid-2025). Because the years differ, treat that UK divorce rate comparison with care.
Why these UK divorce figures cover England and Wales only
Scotland and Northern Ireland have their own courts and a different divorce process (GOV.UK). They also publish their own figures, on their own timetable, so no single table of divorce statistics UK-wide exists. England and Wales are counted together because they share one legal system, which is why there is no England-only divorce rate to look up.
- Scotland: courts granted 7,488 divorces in 2022-23, nearly all in the sheriff courts (Scottish Government, Civil justice statistics 2022-23).
- Northern Ireland: the latest divorce tables from the Northern Ireland Statistics and Research Agency cover 2023 (NISRA).
What the divorce statistics can’t tell you about your own case
The UK divorce rate cannot tell you when to apply, or what to settle first. If you are thinking about divorce, these are the points where timing matters most:
- The one-year bar. Nobody can apply for a divorce until the marriage has lasted a year (Matrimonial Causes Act 1973, s.3).
- Alone or together. You can apply on your own or jointly. GOV.UK says you can apply jointly if you both agree to divorce and you are not at risk of domestic abuse.
- The 20-week pause. After the court issues the application, you must wait 20 weeks before you confirm you want to go on. Our guide to the 20-week reflection period explains what that time is for.
- Six weeks before the end. The court first makes a conditional order. GOV.UK says to wait at least 43 days after it before you apply for the final order, which our guide to the decree absolute and final order covers.
- Money before the final order. If you want a legally binding arrangement for your money and property, GOV.UK says to apply to the court for it before you apply for the final order (GOV.UK). Home rights, which let a spouse stay in a home the other owns, usually end with the marriage unless a court orders otherwise (Family Law Act 1996, s.30(8)). Our page on financial settlement after divorce explains the options.
GOV.UK says a divorce normally takes at least 7 months, whether you apply alone or together. The fee to apply is £628.
Beyond the UK divorce statistics: is your first step on track?
Whatever the UK divorce rate says, your own first step turns on a few practical points. Tick what is already true for you. It is a quick way to spot gaps, but it does not replace advice.
There is no score. Anything you cannot tick yet is worth raising before you apply.
The calls a checklist can’t make for you
- Whether you need a financial order alongside the divorce, and how to make an agreement binding.
- When to apply for the final order, given what it changes for the home and pensions.
- How to settle arrangements for the children if the two of you cannot agree.
These depend on your circumstances, and they are much easier to get right before you apply than afterwards.
Book a free initial consultation
One of our specialists will give you initial advice on your situation.
Frequently asked questions
What are the odds of getting a divorce in the UK?
The UK divorce rate cannot give you your personal odds. The closest guide is the ONS data for England and Wales. Of couples who married in 1998, 40.7% had divorced by their 25th anniversary. Of those who married in 2013, 16.8% had divorced within ten years. Your own chances depend on your relationship, not on the average.
How many couples divorce after 40 years of marriage?
Relatively few. ONS follows couples who married in 1963: 22.8% had divorced by their 25th anniversary, 27.0% by their 50th and 27.1% by their 60th. So only around 4 in every 100 of those marriages ended in divorce between the 25th and 50th anniversaries. The latest bulletin does not give a separate 40-year figure.
What percent of marriages make it to 25 years?
Of couples who married in 1998, 40.7% had divorced by their 25th anniversary, so just under 6 in 10 had not divorced by then. That is not quite the same as reaching 25 years together, because some marriages end when a spouse dies. For couples who married in 1963, the figure at the same point was 22.8%.
What is the most common age for divorce in the UK?
ONS stopped reporting age at divorce from the 2020 data year. Its 2018 bulletin put the average age at divorce at 46.9 for men and 44.5 for women in opposite-sex couples. In 2017, divorce rates were highest for men aged 45 to 49 and women aged 40 to 44. These figures cover England and Wales.
Is the divorce rate different in England compared with the rest of the UK?
There is no separate divorce rate for England, because ONS publishes England and Wales together as one jurisdiction. Scotland and Northern Ireland are genuinely different: each has its own courts, its own divorce law and its own statistics. The no-fault law that changed divorce here in April 2022 extends to England and Wales only (Divorce, Dissolution and Separation Act 2020, s.7(1)), so Scotland still works on proving the marriage has broken down irretrievably. The numbers are not comparable either, because each nation counts on a different basis and publishes for a different period. What matters for you is which nation you can apply in, not which figure is higher.
Are divorce rates different for same-sex couples?
Yes, and from September 2026 ONS publishes the two separately. In 2025, the rate was 19.5 divorces per 1,000 people in a same-sex marriage, against 8.4 for opposite-sex marriages. ONS warns that the same-sex figure moves around more, because same-sex married people are a small sample. There were 2,123 same-sex divorces, the highest yearly figure so far, and the median length of those marriages was 7.5 years for male couples and 6.6 years for female couples, compared with 13.0 years for opposite-sex couples.
Thinking about divorce yourself? Get advice before you apply
The UK divorce rate tells you how many marriages end, not how yours should. The order you do things in matters, because applying for the final order before your finances are settled can leave the home and pensions exposed. Book a free initial consultation and one of our specialists will give you initial advice tailored to your circumstances. You can also read more about our divorce specialists.
Expert Tip
People often ask whether it is safe to finish the divorce while the money is still being worked out. Often, it is not. Once the final order is made, you are no longer married, and your right to stay in a home in your spouse’s sole name can end. Remarrying before you apply for a financial order can also shut you out of most claims. So get advice on the order of each step before you apply.
Garry Steedman, Family Law Consultant (Divorce, Children & TOLATA)